25 May 2015
Using satellites to estimate the MOC
My new paper is now published at Geophysical Research Letters.
Frajka-Williams, E. (2015), Estimating the Atlantic overturning at 26°N using satellite altimetry and cable measurements, Geophys. Res. Lett., 42, doi:10.1002/2015GL063220.
 It uses the 10-year time series of data from RAPID at 26N in the Atlantic to determine a relationship between sea level variability in the Atlantic and the top 1000-m transport estimated from moorings. The main result is a simple statistical correlation between this transport time series, on interannual timescales, and the sea surface height in the western part of the subtropical North Atlantic.
The correlation is quite strong, as can be seen in Fig. 2 of the paper:
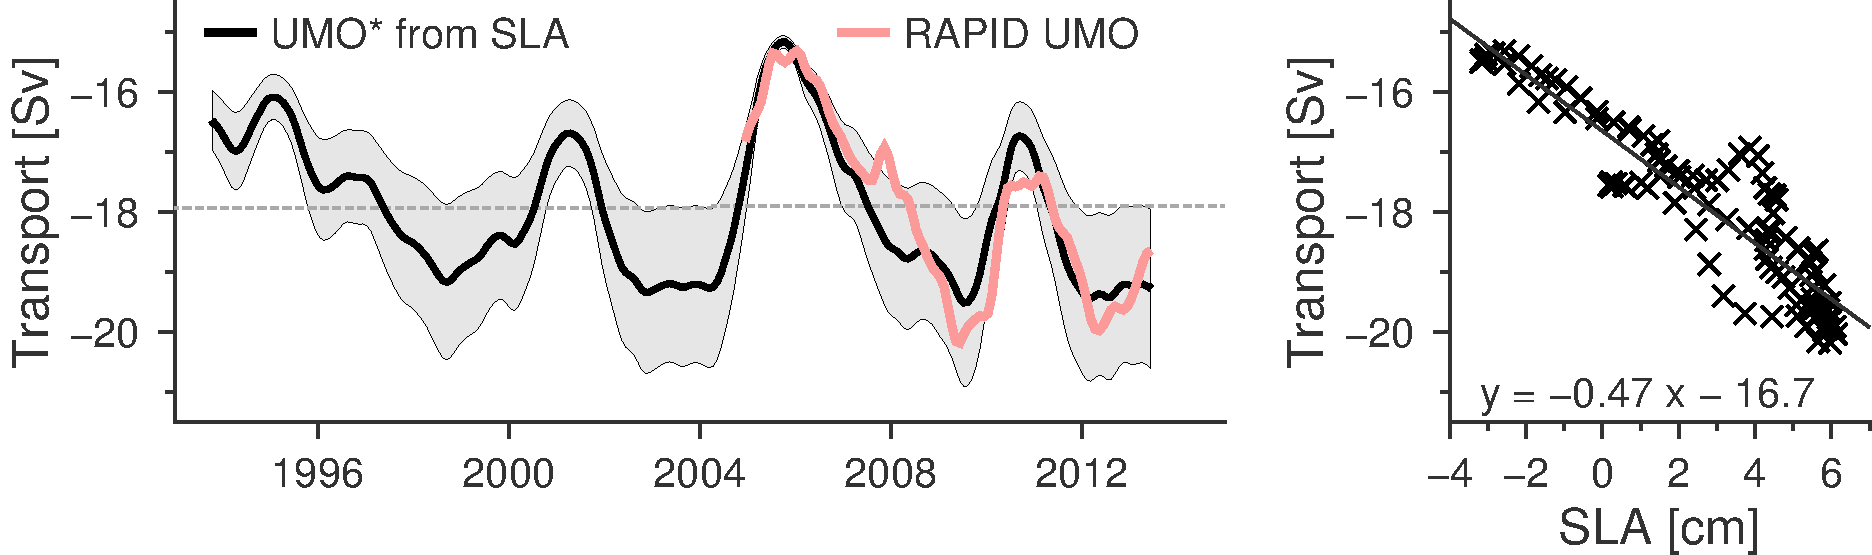
(left) Time series of UMO transport from RAPID (pink) and the SLA proxy, UMO* (black) based on linear regression between UMO and SLA. Gray shading indicates uncertainty associated with the slope of the regression. The dashed grey lines mark the mean of UMO* over the two decades, 1993–2003 and 2004–2014. (right) Scatterplot between the SLA centered at 30°N, 70°W and UMO transport (r = 0.92), with the best fit linear regression overlaid and 95% confidence.
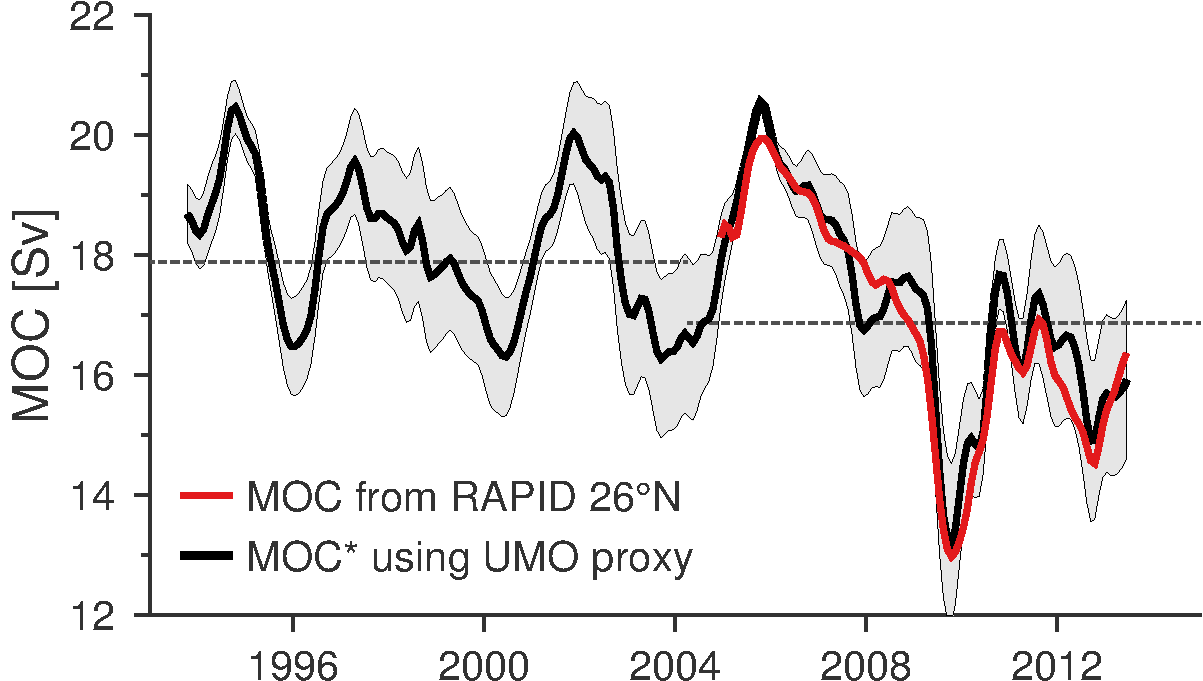 Since the MOC at 26N is estimated as the sum of three components, MOC=Ek+FC+UMO, where Ek = surface Ekman transport, FC = Florida Current transport and UMO = upper mid-ocean transport (roughly the north-south volume transport in the top 1100 m between the Bahamas and the Canary Islands), if we can estimate the UMO from altimetry and we have estimates of the Ek and FC from surface wind products and the Florida Cable measurements, then we can estimate the MOC back in time.
The main results of the paper are that
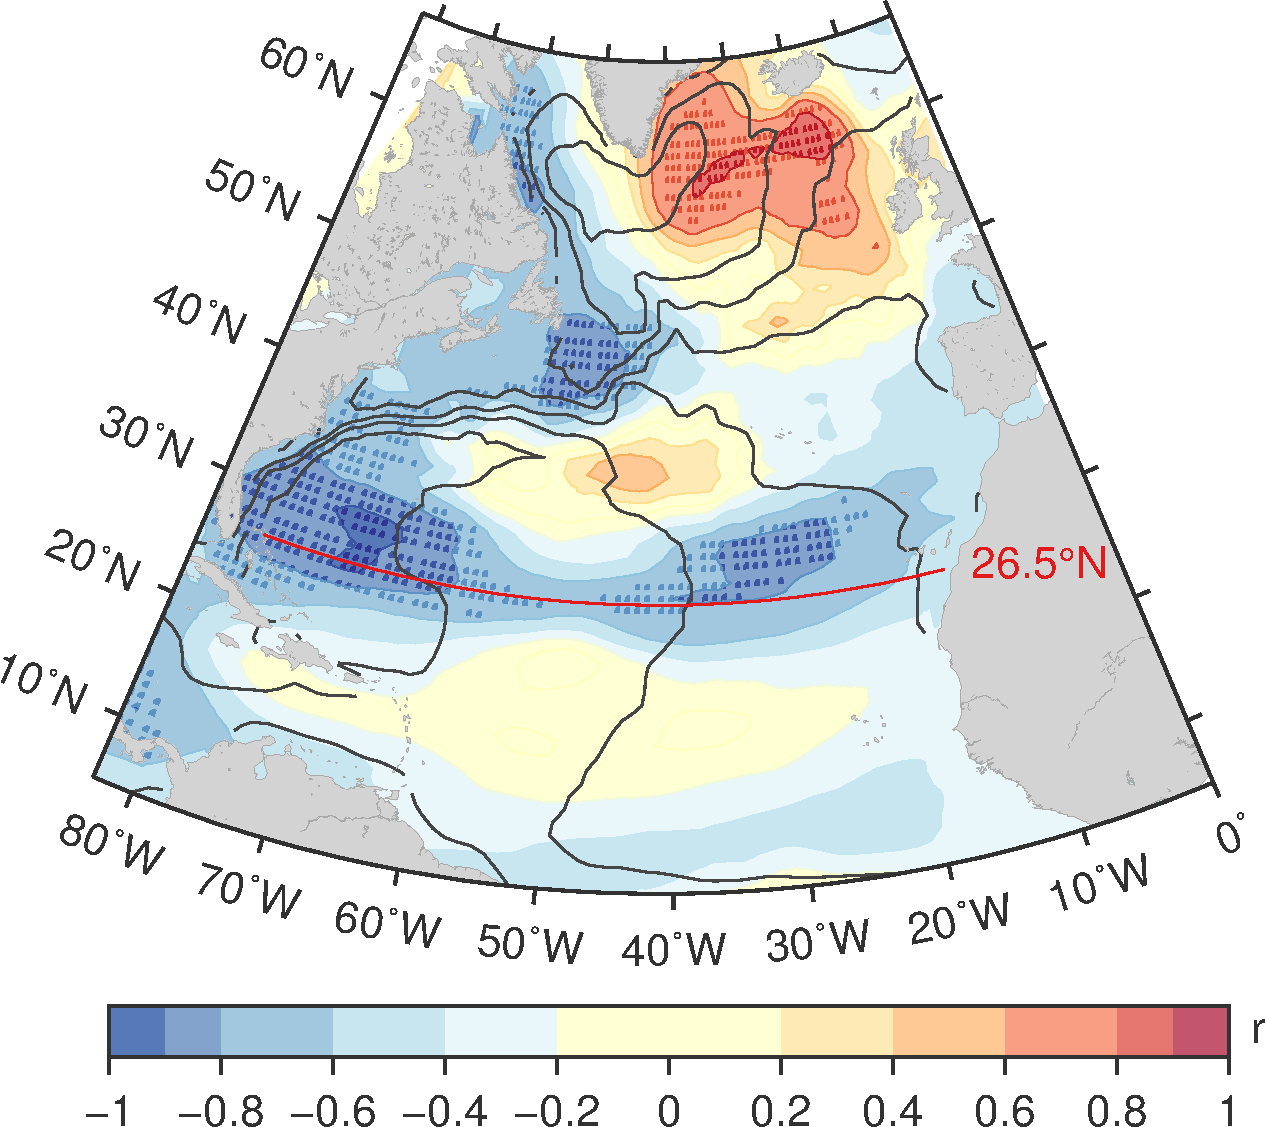
- On interannual timescales, the transbasin transport at 26N is primarily governed by changes in the ocean at the western boundary (near the Bahamas) and not in the east
- There is a strong relationship between spatially-smoothed sea surface height anomalies and the transbasin transport
- Using this relationship, we can estimate the interannual variability of the MOC since 1992. While the downturn identified in Smeed et al. (2014) in Ocean Science does not appear to be a continuation of a longer-term trend, according to the estimates here, there does appear to be a reduction in the overall strength of the AMOC from before 2004 to present.
This paper is open access (free to the public) at GRL, so you can read the whole thing here: http://dx.doi.org/10.1002/2015GL063220
Eleanor Frajka-Williams
PAPER
rapid